Since Spring 2024, Bonsai ACG’s Neuroscience arm has been developing a computer vision pipeline to automate the classification of dendritic spines from Golgi-stained images. With neurodegenerative diseases such as Alzheimer’s Disease, Parkinson’s Disease and Huntington’s Disease affecting millions worldwide, a deeper understanding of how neurons communicate — or rather fail to do so — has become a very active field of research in recent years. It is for this reason that much significance has been placed on the neuronal structure that is responsible for receiving information from other neurons: dendritic spines. While both losses of and morphological changes in dendritic spines have been associated with neurodegeneration, existing methods to quantify dendritic spine morphology are labor intensive, subjective, and require specialized imaging technology.
Bonsai ACG’s software EZspine is being developed to address this need for an objective, easily integrable spine-analysis method. EZspine reads Golgi-stained Z-stacks, the most accessible and widely-used approach to image neurons for spine analysis. While Golgi-stained images are often noisier than images captured using alternative techniques, we have integrated numerous image-processing techniques with custom computer vision algorithms to reliably prepare even the most artifact-ridden images for spine analysis. By extracting only in-focus regions of these cleaned Z-planes, EZspine is effectively able to reconstruct dendrites in 3D-space using only a Z-stack of 2D Golgi-stained images. Following this reconstruction, EZspine segments spines from the dendritic shaft before classifying them into established morphological bins: “mushroom,” “stubby,” “thin,” etc. While existing approaches take anywhere from hours to weeks, this pipeline classifies dendritic spines in only a few minutes with minimal user intervention.
With this method being reliable, efficient, and using only the same Golgi-stained images that most researchers in this field capture, we hope to provide a spine analysis method that can be integrated into labs — and used to accelerate investigations into neurodegenerative disease — immediately. We plan to publish this method and release the open-source EZspine software this year.
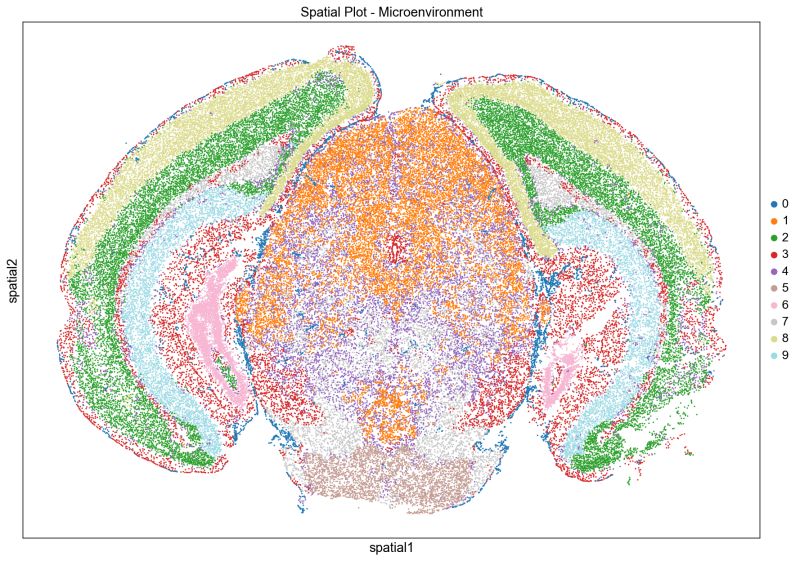
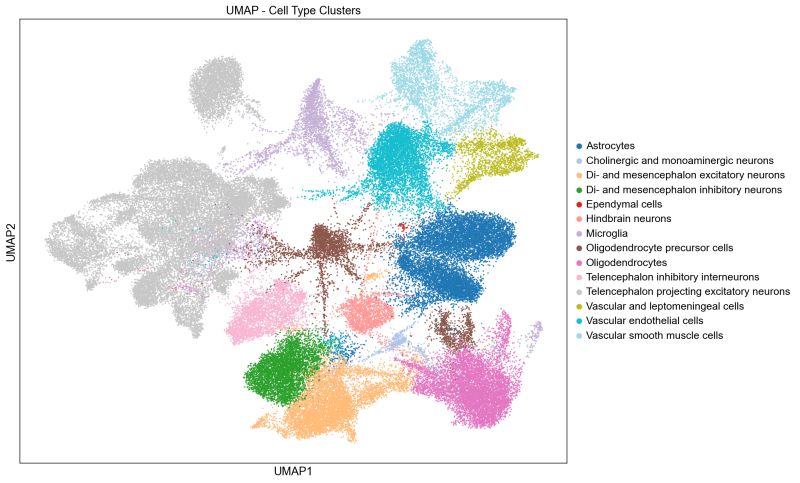
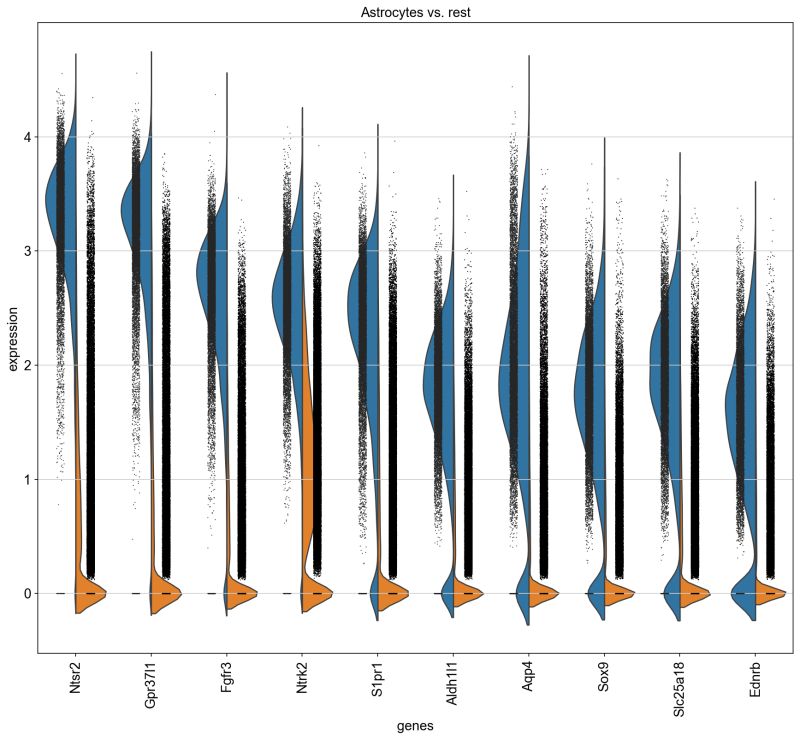
In Fall 2024, the Bonsai biology team developed a comprehensive spatial transcriptomics pipeline to analyze data generated using MERFISH (Multiplexed Error-Robust Fluorescence In Situ Hybridization) technology. MERFISH is a state-of-the-art method that identifies and quantifies thousands of RNA molecules within tissue samples at single-cell resolution. The pipeline was meticulously crafted to process MERFISH outputs by performing tasks such as mapping cells back to a reference atlas for identification through Leiden clustering, identifying cellular neighborhoods using spatial data, precisely linking RNA transcripts to their cellular origins, and conducting differential expression analysis to uncover genes that are highly over-expressed or under-expressed within specific cell types.
To enhance usability, the team created an automated visualization suite that explores data in Euclidean, UMAP, and PCA spaces, along with generating gene expression charts. These tools are being actively used at the Miami Project to Cure Paralysis to study models of Experimental Autoimmune Encephalomyelitis (EAE) and Traumatic Brain Injury (TBI), driving meaningful insights in neurological research Biology.
Bonsai’s Quantitative Finance team had an exciting opportunity to participate in IMC’s Prosperity-2, a highly competitive, 15-day long trading simulation. This event provided a unique platform for our team to apply quantitative analysis in a fast-paced, simulated marketplace, where real-time decision-making was key to maximizing returns. The competition was not just about making profits; it was about honing our ability to develop and execute advanced trading strategies using data-driven insights.
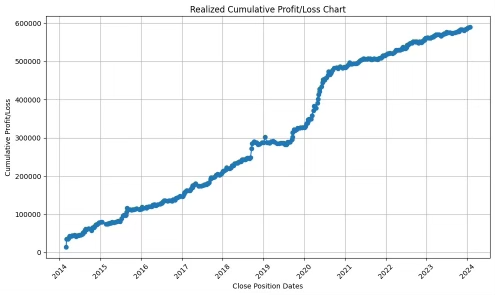
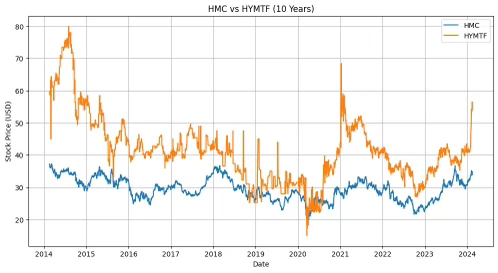
Throughout the competition, we focused on statistical arbitrage, a strategy that involves identifying pairs of assets whose prices move together but temporarily diverge. By using various forms of statistical analysis, our team was able to identify the ideal pairs for trading. We employed comprehensive backtesting techniques to evaluate the effectiveness of our strategies across historical data, assessing performance metrics such as realized profit and loss, Sharpe ratio, and drawdowns. These analyses provided us with crucial insights into how the strategies performed under different market conditions.
In addition to statistical arbitrage, we implemented machine learning techniques to enhance our decision-making. A key innovation in this project was the development of a Jupyter notebook to identify optimal pair-candidates using k-means clustering, a method for grouping similar data points. To refine our entry and exit points, we utilized a Long Short-Term Memory (LSTM) model, a type of recurrent neural network that is particularly effective for forecasting time-series data. This allowed us to predict price movements and optimize our trading positions, giving us a competitive edge.
Our participation in the Prosperity-2 competition was a rewarding experience that expanded our understanding of quantitative finance, statistical analysis, and machine learning in trading. The strategies we developed and the lessons we learned during this competition will inform future projects as we continue to explore the intersection of finance and data science.
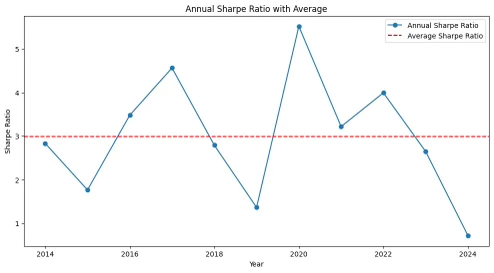
The Quant team spent the Fall 2024 semester researching and developing a cross-arbitrage pairs trading strategy between prediction markets Kalshi and Polymarket. The focus was on event contracts related to Federal Reserve interest rate cuts, specifically the market for predicting four rate cuts in 2024. To execute this strategy, the team aggregated daily price data from both exchanges using APIs and formatted it into a CSV file for analysis.
The team conducted a Pairwise Engle-Granger test to confirm mean reversion tendencies between the contracts. Based on the results, they designed an arbitrage strategy that analyzed the 10-day rolling average spread between the contracts and established Bollinger Bands at one standard deviation above and below the rolling average. Trades were triggered when the spread crossed these bands, leveraging mean-reversion tendencies for profit.
The backtesting process recorded opening and closing trades, calculated profit and loss, and assessed the strategy's performance through metrics like the Sharpe Ratio. In the upcoming semester, the team plans to extend their research to backtest strategies involving equities, derivatives, ETFs, and cryptocurrencies.
This semester, our team focused on integrating the Multibeam Activity Detector (MAD), a custom data acquisition device designed to record behavioral data from up to 16 fruit flies using infrared laser sensors. To achieve this, we developed a C script capable of interpreting the digital input signals generated by the MAD, translating them into a usable format for analysis. This foundational work ensured accurate and efficient data collection from the device.
Building on this functionality, we implemented an automated data pipeline to streamline the processing and storage of the recorded data. Data from the MAD is saved as CSV files and uploaded to a cloud-based database hosted on Amazon Web Services (AWS). Additionally, we created an interactive frontend GUI that accesses the database, allowing users to visualize and explore the collected behavioral data seamlessly.
Looking ahead, we plan to perform exploratory data analysis (EDA) to identify patterns and derive meaningful insights from the recorded data. If this analysis reveals actionable trends, we will explore the development of machine learning models to make predictions based on the fly behavior. These efforts aim to advance the understanding of behavioral dynamics and enhance the utility of the MAD system.
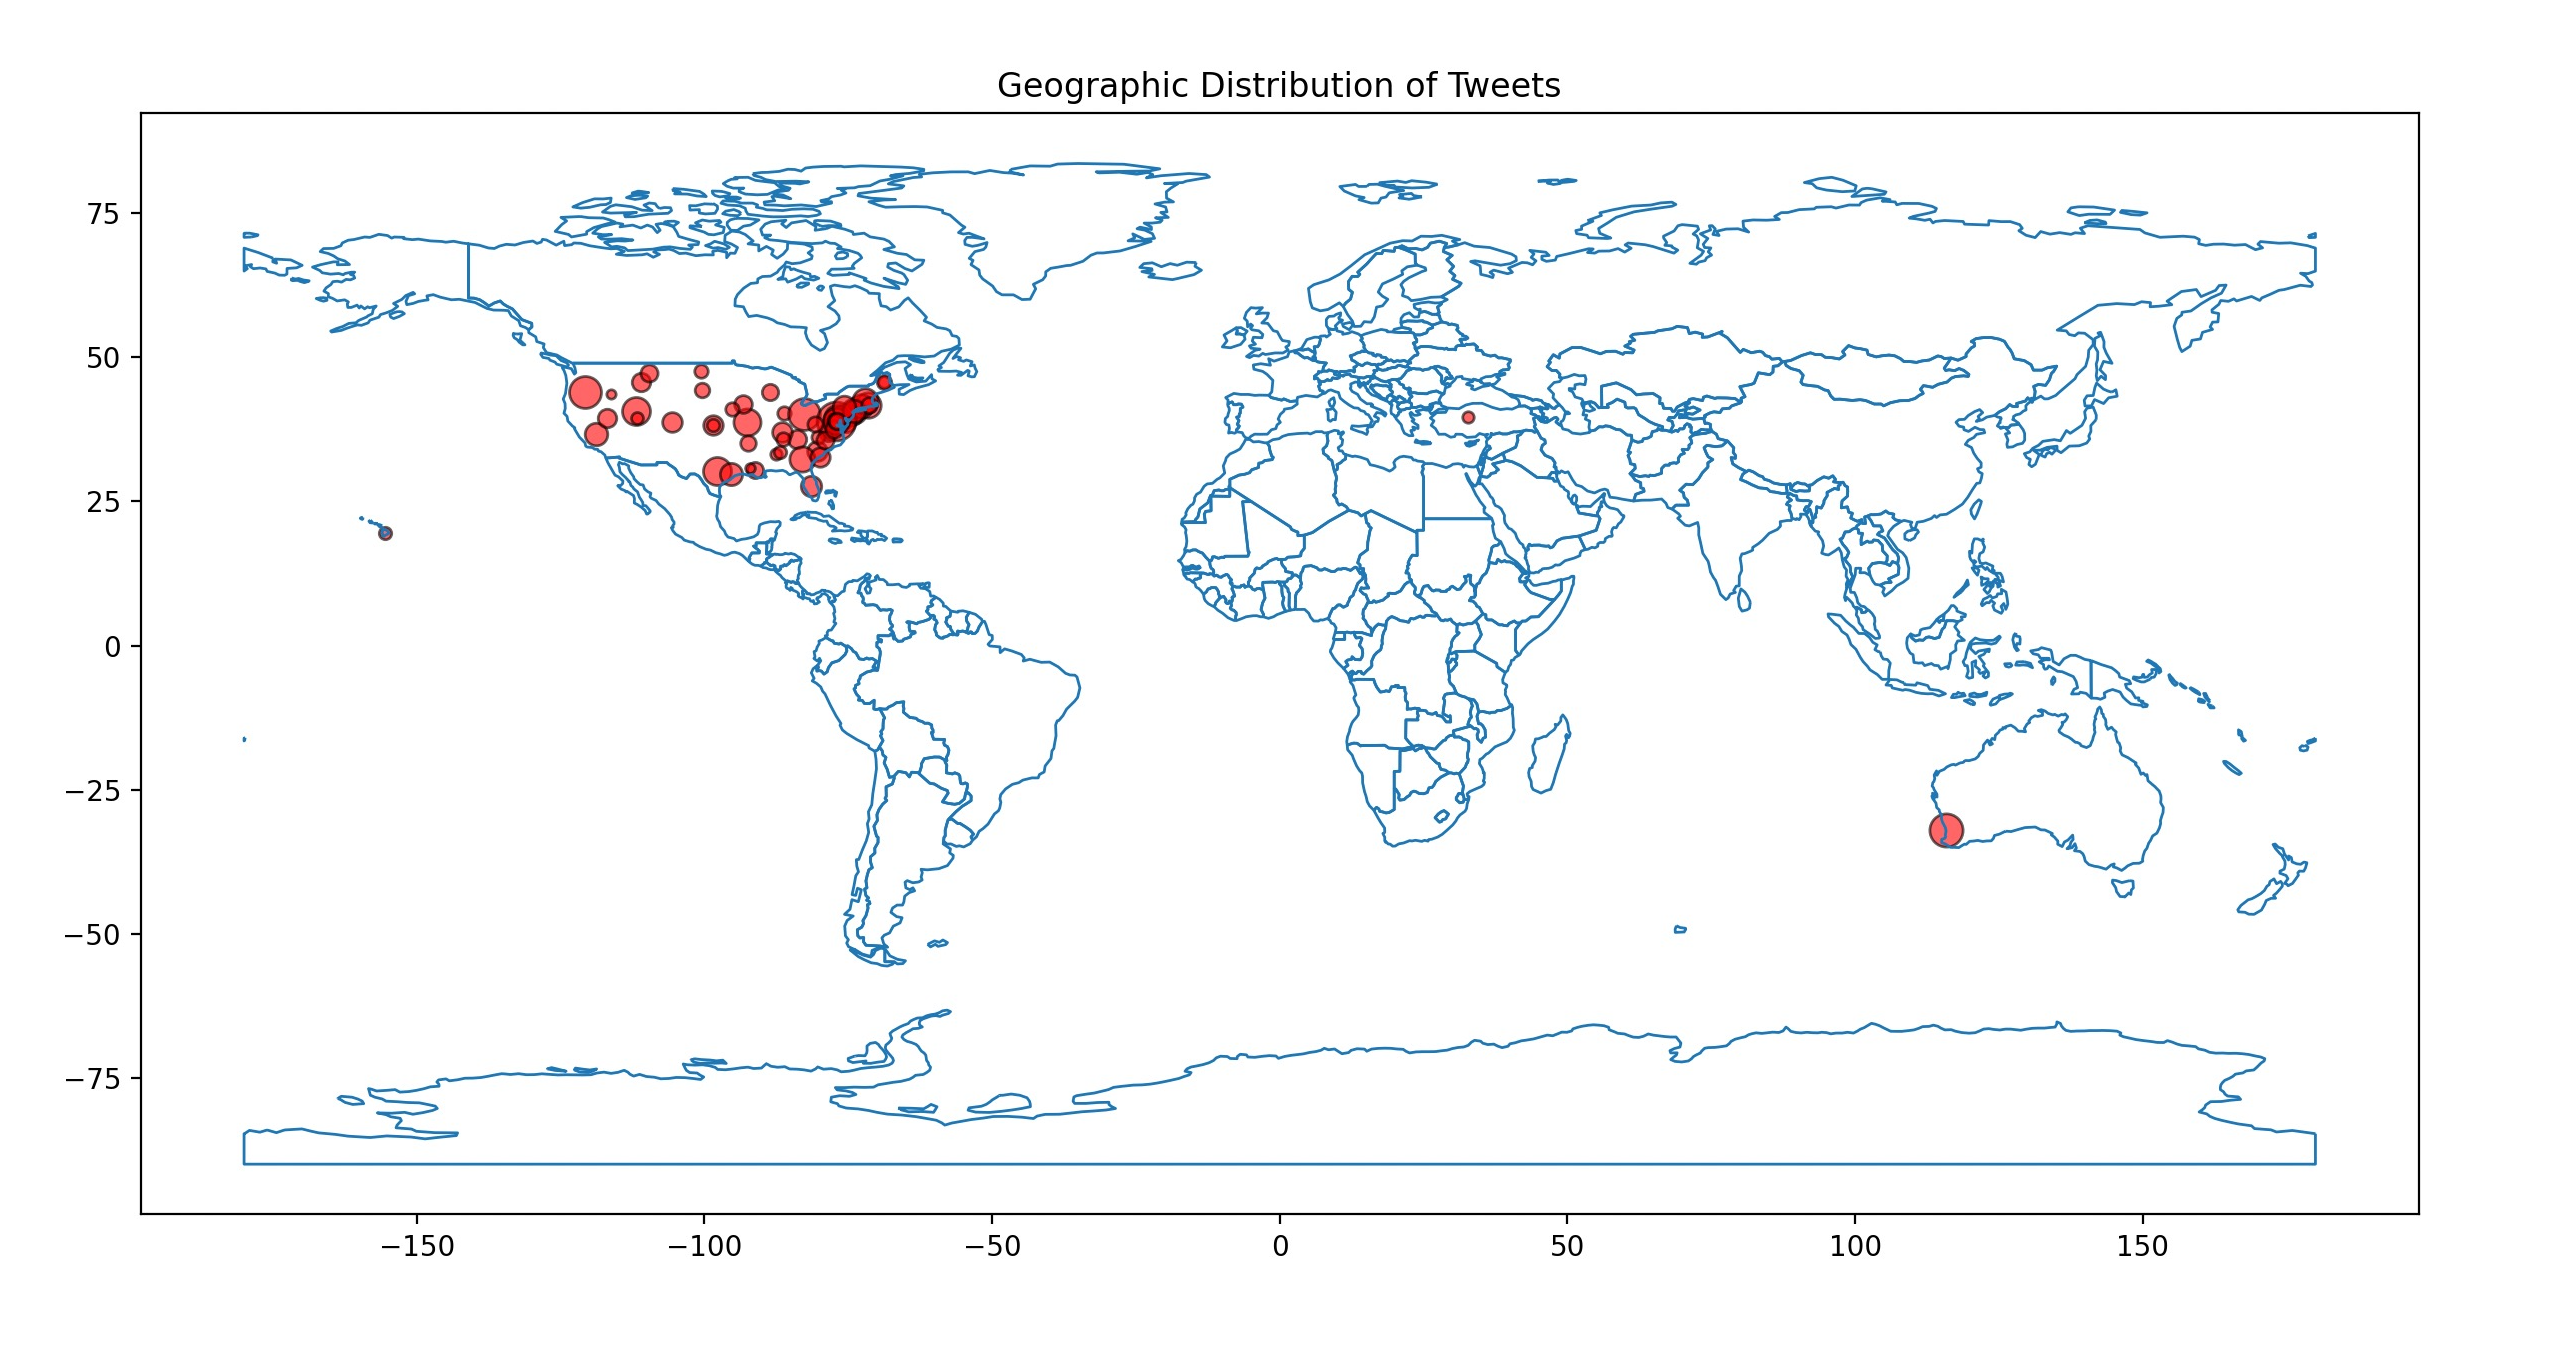
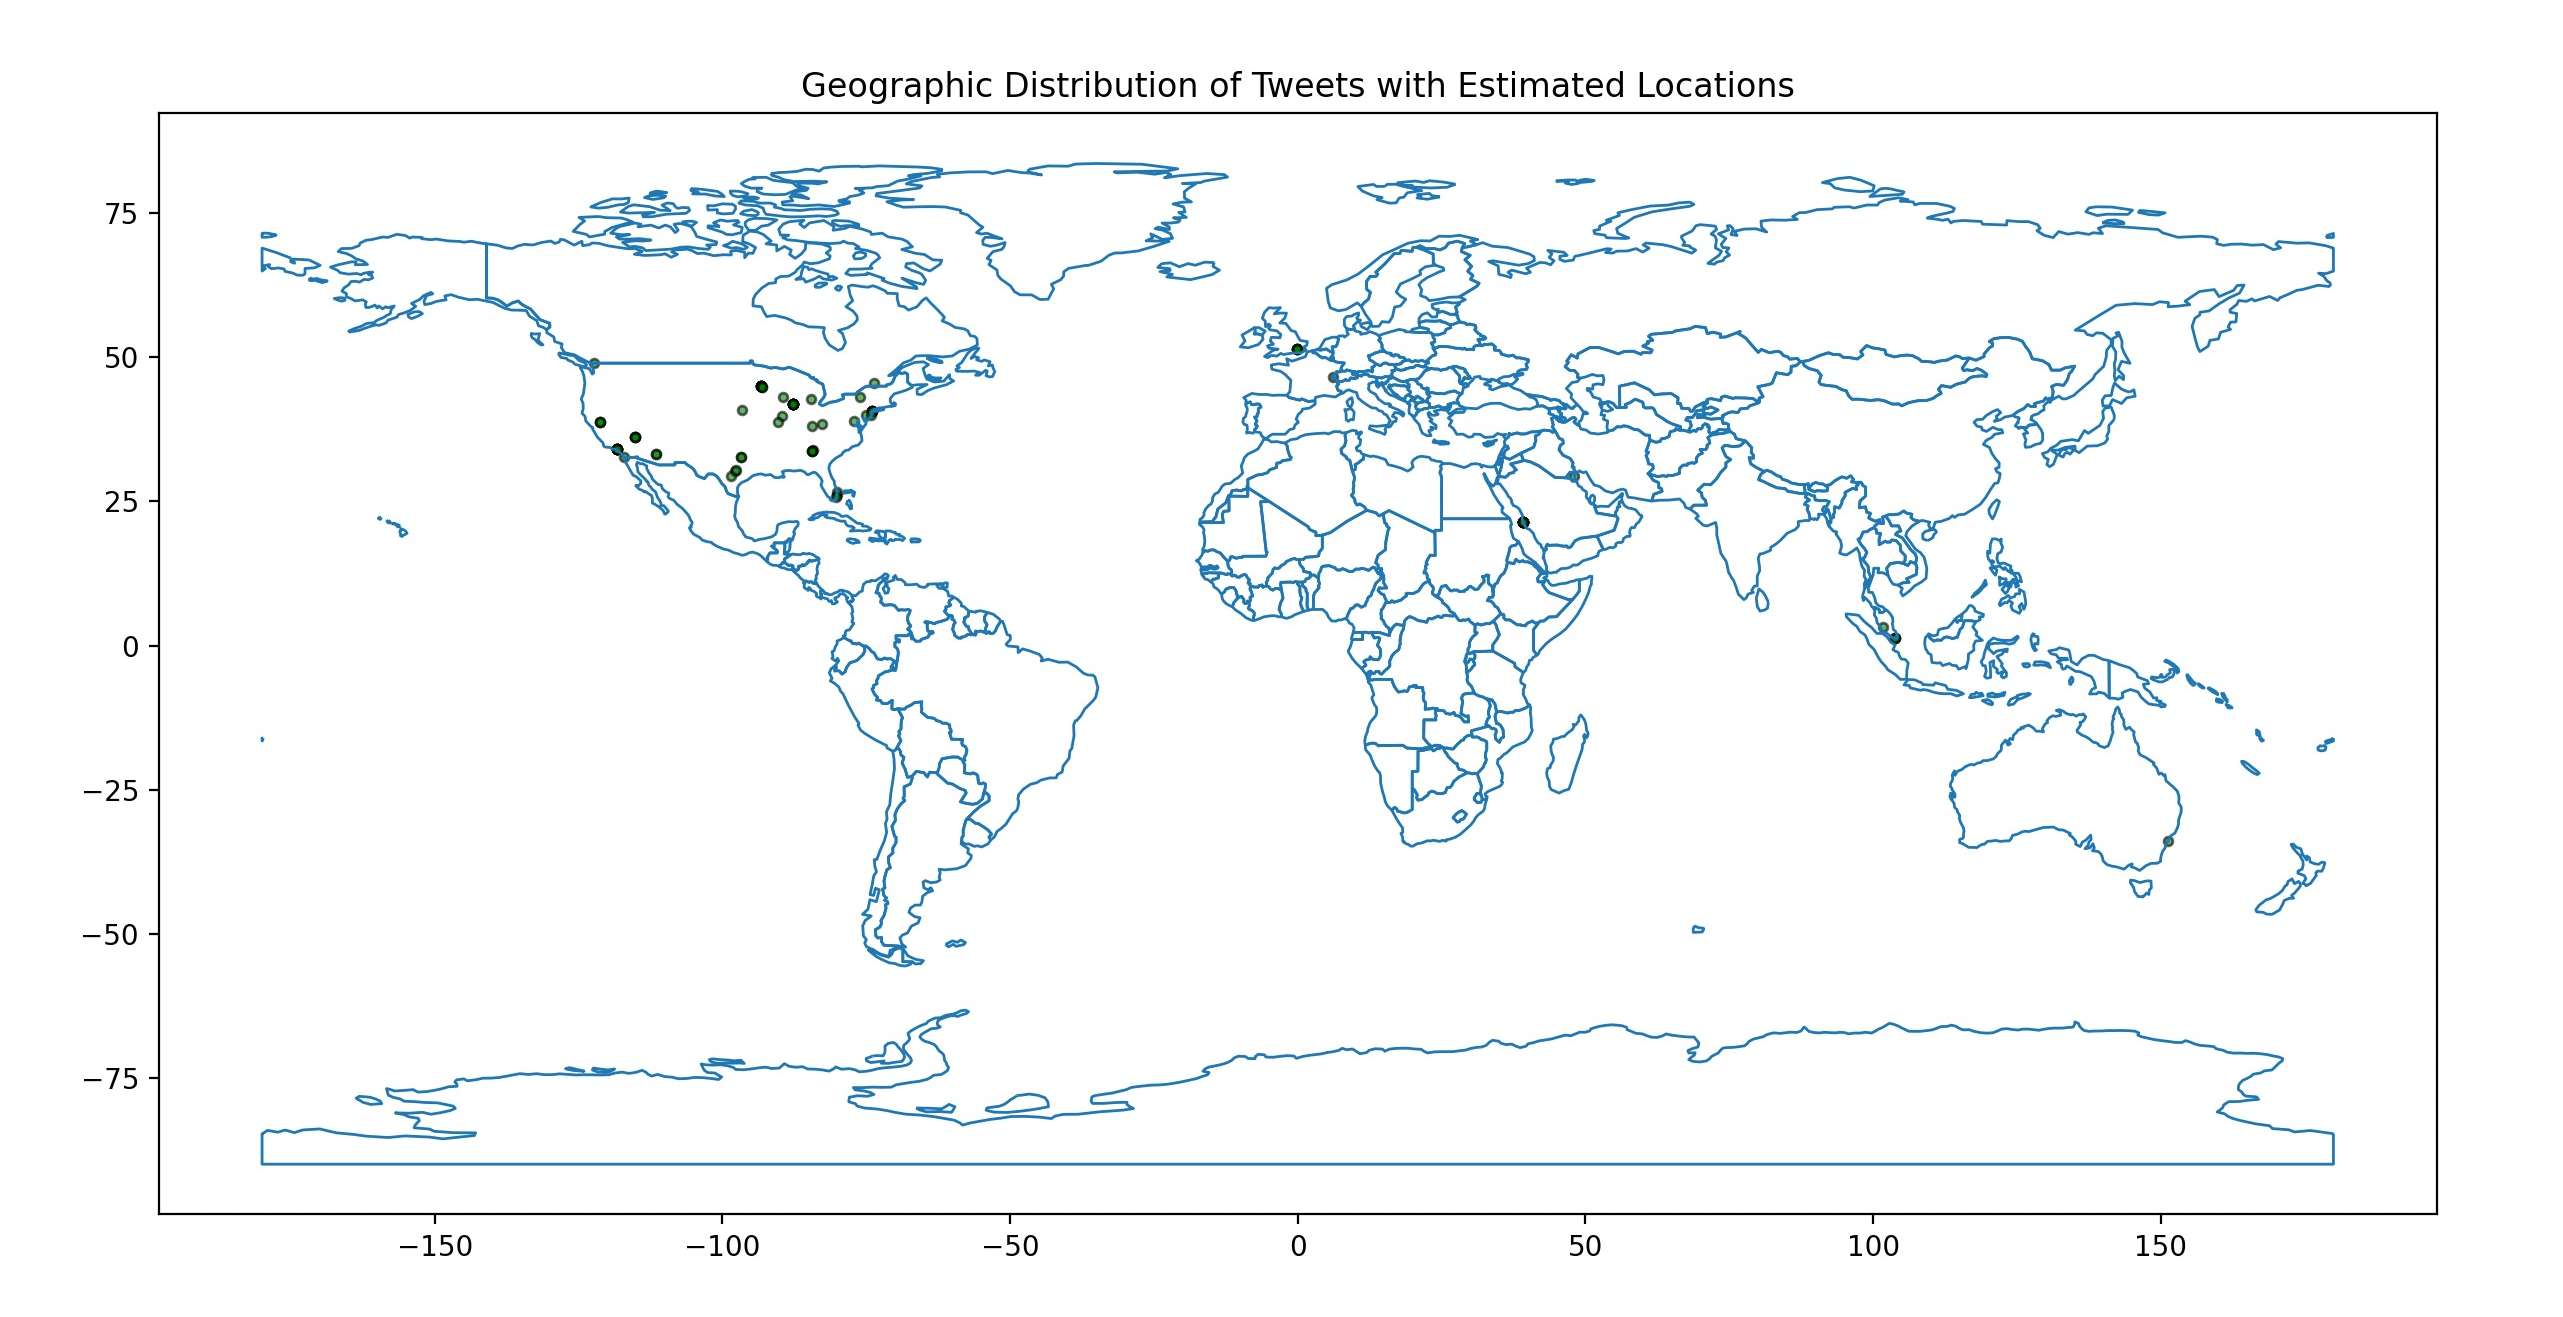
In the Spring semester of 2024, Bonsai ACG’s marketing and business team undertook a significant Twitter data analysis project in partnership with the University of Miami’s Business School. The project, funded with a $5,000 budget, aimed to analyze and visualize geospatial trends across over 700,000 tweets. This large-scale data analysis effort provided deep insights into social media behavior and trends, offering invaluable information for both academic research and business applications.
Our team began by managing the budgeting, data collection, and technical infrastructure needed to handle this vast dataset. We utilized Twitter’s professional API to gather the data, which included several millions of data points such as tweet content, tweet metadata, and user metadata. One of the main challenges we faced was that a significant portion of tweets lacked explicit location data, which was crucial for the geographic analysis we were tasked with conducting.
To overcome this, we implemented geolocation inference using the Pigeo repository. This tool allowed us to infer the location of tweets even when explicit geotags were missing. However, one of the key challenges we encountered was understanding the dependencies of this older tool and learning how to effectively run subprocesses to make it function within our modern data pipeline. This required extensive research and trial-and-error as our team delved into documentation and community forums to troubleshoot compatibility issues and ensure smooth integration. By analyzing tweet metadata, including language and timezone information, we were able to estimate geographic data, enabling a robust analysis of social media trends by region.
The data processing and analysis phase was extensive, involving the cleaning, sorting, and visualization of the tweet data using Python. Our team conducted an in-depth examination of the error rates associated with geolocation and data collection methods, ensuring the integrity of our findings. The final product was a series of visualizations and reports that illuminated social media trends across various geographic regions, offering both academic researchers and business analysts a powerful tool for understanding the dynamics of online communication. This project tested Bonsai Analysts’ ability to manage large-scale data collection and analysis efforts.
The Product Development team developed a platform to revolutionize the process of prototyping and optimizing physical products. This platform, designed in collaboration with the Marketing Department at the Miami Herbert Business School, utilizes genetic algorithms to iteratively refine product attributes based on user feedback.
The platform’s architecture is built using the Flask web framework, providing a lightweight yet robust foundation for developing web applications. It features endpoints for initiating user sessions and processing gathered data to update the genetic algorithm's parameters. Docker containerization ensures consistency and scalability across environments, while hosting on PythonAnywhere provides a cost-effective and reliable solution.
To enhance user experience, the team designed an intuitive front-end interface hosted on GitHub Pages, allowing stakeholders to interact seamlessly with the system. By simulating evolutionary processes such as selection, crossover, and mutation, the platform rapidly converges on designs that align with consumer preferences. This approach significantly reduces the time and resources required for traditional product development cycles, showcasing Bonsai’s ability to integrate advanced algorithms with user-friendly tools.
In Fall 2024, the Marketing team analyzed a large dataset of political tweets related to the 2024 U.S. Presidential election. The project involved processing extensive CSV files, each containing tens of thousands of tweets and an array of metadata. The primary focus was on the textual content of tweets that mentioned one or both presidential candidates.
Using OpenAI's API, the team conducted sentiment analysis across the datasets, creating a combined database of over 500,000 sentiment-scored tweets. This enabled the construction of time-series plots to visualize sentiment trends for each candidate as the election approached. Methods such as simple moving averages were applied to highlight significant shifts in public opinion as captured through the lens of Twitter/X.
Future efforts will aim to leverage the remaining metadata to generate more nuanced visualizations, exploring correlations with geographic, temporal, and user-related variables. The team also plans to develop an interactive GUI featuring advanced visualization tools to empower users to dynamically explore and interpret the dataset, paving the way for broader applications in social media analytics.
The Law team focused on developing the Bluebook AI Citation Tool, a sophisticated multi-agent software system designed to automate the generation of accurate legal citations. This system allows users to input incomplete source data, which specialized agents then process independently for specific citation types, such as case law, journal articles, and books. These agents leverage APIs like CourtListener, Google Scholar, and OpenLibrary to retrieve necessary metadata.
Once the metadata is collected, it is processed by an advanced LLM-based agent to construct precise, Bluebook-compliant citations. The seamless integration of these agents ensures that even ambiguous inputs result in properly formatted citations. Looking ahead, the team plans to expand the system’s API integrations and improve metadata retrieval accuracy, providing an efficient and reliable solution for researchers and legal professionals.